Introduction
In dynamic digital organizations, it’s essential to enable teams to monitor key project parameters and identify what’s working well and what’s not. Azure DevOps gives teams capabilities to track some DevOps parameters and make improvements but falls short in a few areas.
- Limited customization – Basic analytics in Azure DevOps may not offer the level of customization needed for some teams’ specific reporting requirements. For example, teams may need to track specific metrics or create complex reports that are not supported by the built-in analytics.
- Restricted cross-organization insights – Basic analytics in Azure DevOps may not support cross-organization reporting, making it difficult for large organizations with multiple Azure DevOps projects to gain holistic insights into their development processes.
In this blog post, we will explore how Azure DevOps Advanced Analytics coupled with Power BI Integration enables effective monitoring and analytics, helping teams optimize their workflows and deliver high-quality software efficiently.
Data connection methods for Advanced Analytics
Azure DevOps gathers data across the software development lifecycle – during code commits, application builds, testing and deployments. This information is crucial for knowing how the development lifecycle is progressing, finding where things slow down, and making them better. When Azure DevOps is coupled with Power BI, teams can maximize the outcome by turning the data into valuable insights using advanced analysis and visuals. Azure DevOps provides capability to expose this data in various connection methods which can be consumed in Power BI for reporting.
- Connect using the OData queries – Power BI can use OData queries, which are great for sorting and combining data before it comes back to Power BI. This requires writing OData queries, which are akin to writing SQL queries. This is usually the best way to go for most categories of information from Azure DevOps.
- Connect using the Azure DevOps Data Connector – The Azure DevOps Data connector functions exclusively with analytics views and is the preferred option for Boards data. Using this capability, complex views on Boards data can be shared out to Power BI without the need for further data processing.
- Connect using the Power BI’s OData Feed connector – Power BI offers an OData Feed connector, that allows connecting to and browsing the analytics OData endpoint. Users can navigate and choose entities and utilize the Query Editor to refine the dataset through filtering. Consider employing this approach solely for small-scale accounts. Since server-side query folding is not supported, this approach requires all data to be fetched into Power BI before filters can be applied. While this method may suffice for smaller accounts, larger accounts may experience prolonged refresh times and timeouts.
Creating Custom Reports and Dashboards
With Power BI integration, custom reports and dashboards can be created for specific needs. Power BI has multiple ways to display information, like charts, graphs, tables, and maps – that can be selected to represent the information effectively. Reports can be designed to track metrics such as sprint velocity, backlog health, test coverage, top failing pipelines, top duration pipelines and other important parameters. Multiple options are available to extract data from Azure DevOps, wherein teams can use OData queries, Analytics views or the OData feed connector as described above. Once the data is gathered, custom reports can be built in Power BI Desktop, uploaded to Power BI Service, and then shown on the Azure DevOps dashboard. This can be achieved by using iframe embedding within the Embedded web page widget. 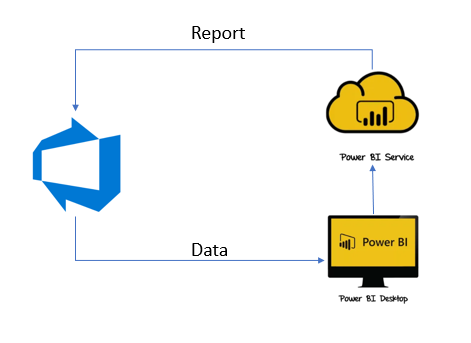
Analyzing Patterns and Trends
Power BI’s advanced analytics capabilities enable teams to analyze trends and patterns within their Azure DevOps data, finding things they might not see at first. Useful features such as time intelligence, forecasting, clustering, and anomaly detection to identify correlations, predict future outcomes, and detect anomalies or outliers can augment the development processes. By understanding historical trends and patterns, teams can make informed decisions, mitigate risks, and optimize workflows effectively.
For example, an enterprise with distributed landscape wanting to have consolidated views on quality and security at application and portfolio level could use Power BI reports with drilldown capabilities. The information from Azure DevOps can be sent to Power BI reports to highlight open vulnerabilities and compliance with respect to mandatory life cycle stages like code quality scans, security scans, etc. Similarly, a ‘month-on-month’ comparison on customized parameters can be used to retrieve the delta and then derive the trend graph indicating upward/downward trends. There can be many more such interesting implementations where enterprises can leverage Power BI reporting.
Stay updated with the latest insights through Scheduled Data Refresh
Refresh schedule can be setup for each dataset in the Power BI workspace. This schedule determines how often Power BI will retrieve data from Azure DevOps and update the dataset. The frequency of data refresh can be specified, such as daily, weekly, or even hourly. Additionally specific times for the refresh can be customized, ensuring that data refresh happens during off-peak hours or when the data is most up to date.
Conclusion
The integration of Azure DevOps with Power BI empowers teams to leverage advanced analytics and visualization tools, helping them make the most of their development data and continuously improve. With Power BI’s extensive reporting capabilities, personalized reports and dashboards can be created thereby allowing teams to study trends and provides insights into their ways of working. These empowered teams can make smart choices, streamline workflows, and help organizations succeed in today’s competitive market.