Ready to dive into how to really get the most out of your manufacturing processes? In today’s fast-paced industrial world, simply having equipment that runs isn’t enough. You need them running efficiently. That’s where Overall Equipment Effectiveness, or OEE, comes into play. It’s a powerful metric that acts like a compass, guiding you towards operational excellence by revealing hidden losses and untapped potential within your production lines.
Now, if you’re operating in a landscape powered by SAP Manufacturing Integration and Intelligence (MII), you’ve got a robust platform at your fingertips. But how do you harness the power of SAP MII to truly unlock the insights that OEE offers?
In this blog post, we’ll embark on a journey to explore the synergy between OEE and SAP MII. We’ll demystify the concept of OEE, break down its core components, and, most importantly, illuminate how SAP MII can be your strategic tool for calculating, visualizing, and ultimately improving your OEE. Get ready to discover how to transform raw data into actionable intelligence and pave the way for peak performance on your plant floor.
Note – The backbone of Infosys’ SAP MII based OEE solution is the standard SAP MII OEE framework with some backend and significant frontend customizations.
Value Drivers
- Standardized OEE Calculation Across the enterprise
- Hierarchical KPIs at Enterprise, Site, Line, and equipment levels
- Real time or near real time Visibility into Production Performance
- Cost saving by increasing operational efficiency, asset efficiency
- Elevating Quality and Slashing Waste with SAP MII Insights
- Empowering Data-Driven Decisions for Continuous Improvement
- Proactive Maintenance and Reduced Downtime
- Real-Time Notifications and Alerts for Immediate Action
OEE (Overall Equipment Effectiveness)
Overall Equipment Effectiveness (OEE) is a manufacturing metric that indicates how efficiently production equipment is being used relative to its maximum possible performance.
Think of it as a comprehensive snapshot of how effectively your equipment is running. Instead of just looking at uptime, OEE considers all the factors that can lead to lost production time and output.
OEE is determined using three primary components:
- Availability: Indicates how much of the planned production time the equipment is actually running. It reflects losses due to events such as breakdowns, setup activities, and adjustments.
- Performance: Measures whether the machine is operating at its optimal speed. It highlights inefficiencies caused by reduced operating speed, brief stoppages, and other speed‑related issues.
- Quality: Represents the proportion of output that meets quality standards compared to the total produced. It captures losses from defects, scrap, and rework.
OEE = 100% represents perfect production with no downtime, running at the ideal speed, and producing only good parts. In reality, achieving 100% OEE is rare, but it serves as a benchmark for continuous improvement.
By understanding and tracking OEE, manufacturers can identify areas of waste and inefficiency in their production processes and implement targeted improvements to boost productivity, reduce costs, and enhance overall operational performance.
Harnessing the power of SAP MII for OEE
Harnessing the power of SAP MII for OEE unlocks a transformative approach to manufacturing excellence. SAP MII acts as the central nervous system, seamlessly integrating the diverse data streams emanating from the plant floor equipment and control systems with overarching enterprise systems. This robust connectivity enables the real-time acquisition and harmonization of critical production data necessary for accurate and insightful OEE calculations. By utilizing SAP MII and its SAP UI5-based dashboarding capabilities, you gain intuitive and informative real-time visibility into OEE performance at every level of your organization, empowering operators, supervisors, and management with the insights they need.
OEE Dashboards
Production Hub
This module provides a comprehensive explanation of the OEE dashboards designed for various levels, including individual equipment/assets, production lines, facilities, and the entire enterprise. The calculation of OEE will be performed automatically, leveraging real-time or near real-time data sourced directly from the shop floor.
A representative screen of an OEE dashboard is presented below with a brief explanation of the different components.
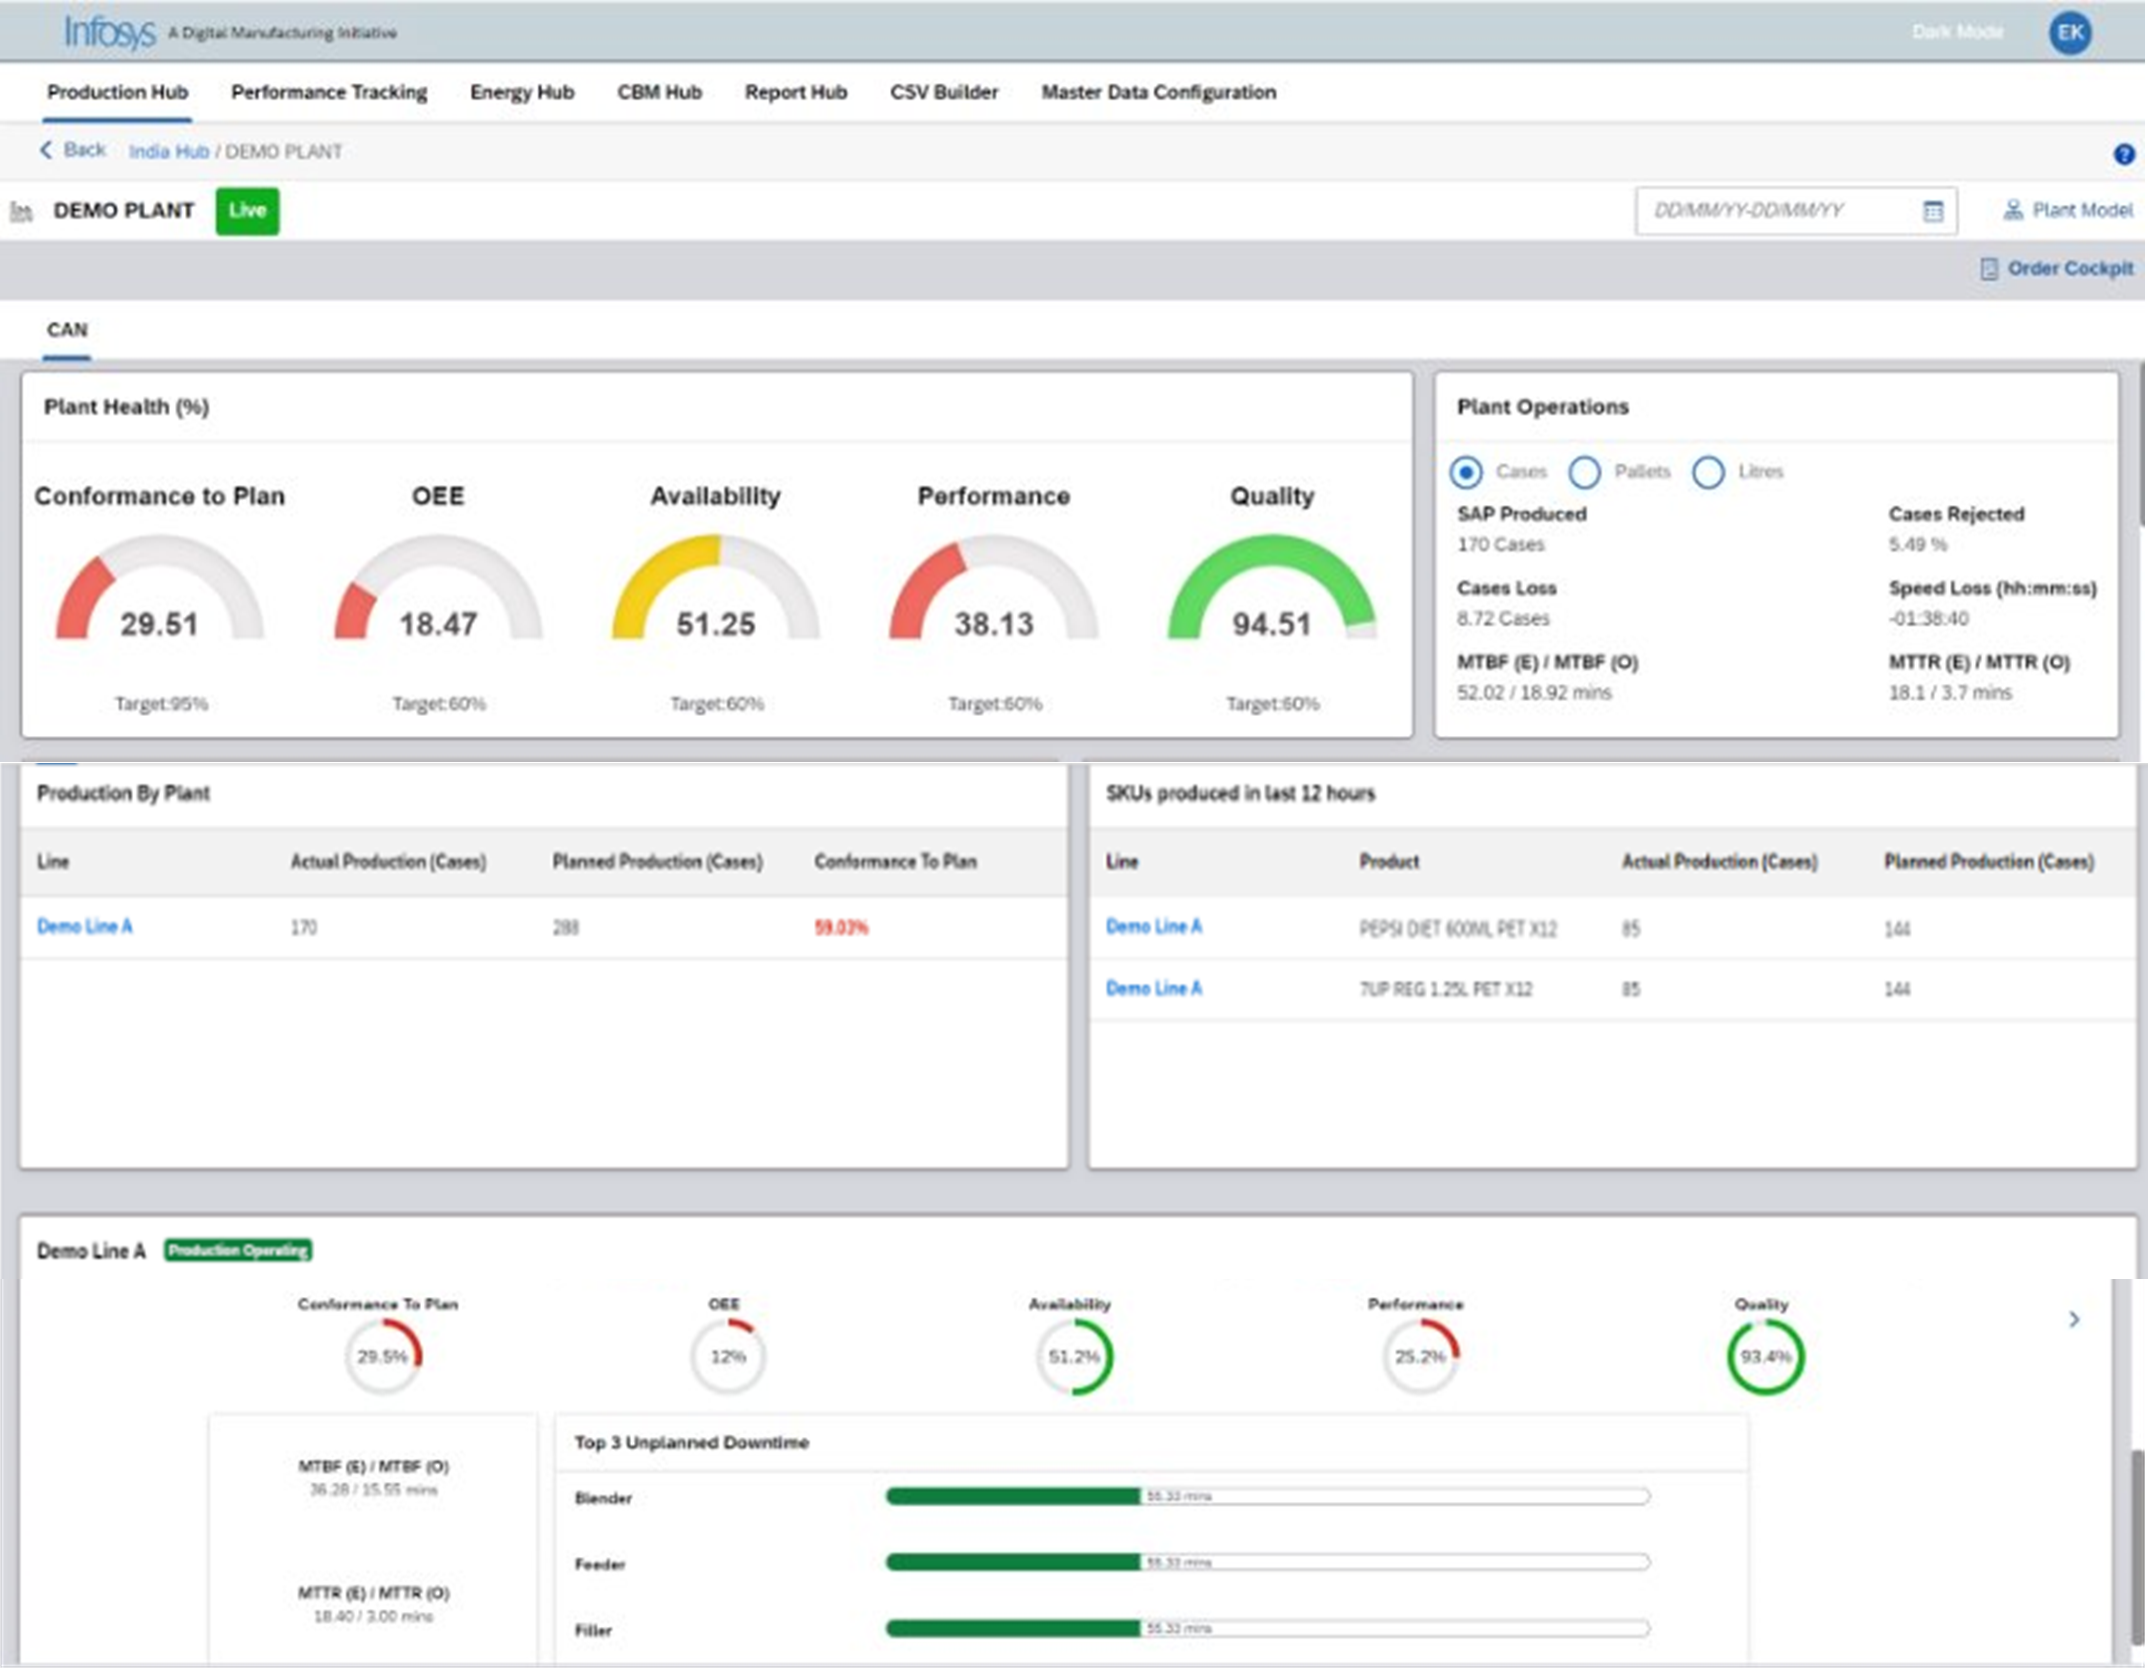
This dashboard shows key production KPIs (Conformance to Plan, OEE, Efficiency, Availability, Performance, Quality) and operational details with graphical visualizations.
Plant model has complete hierarchical structure of Plant, line and machine. The Plant summary section displays image of individual plant and important KPIs (Conformance to Plan, OEE, Efficiency etc), and Downtime Tracking section provides capability of comparing downtimes across lines or machines for a given period.
Performance Tracking
The performance tracking screen allows users to monitor performance (speed loss) or key performance indicators (KPIs) like OEE and efficiency for a chosen line or facility.
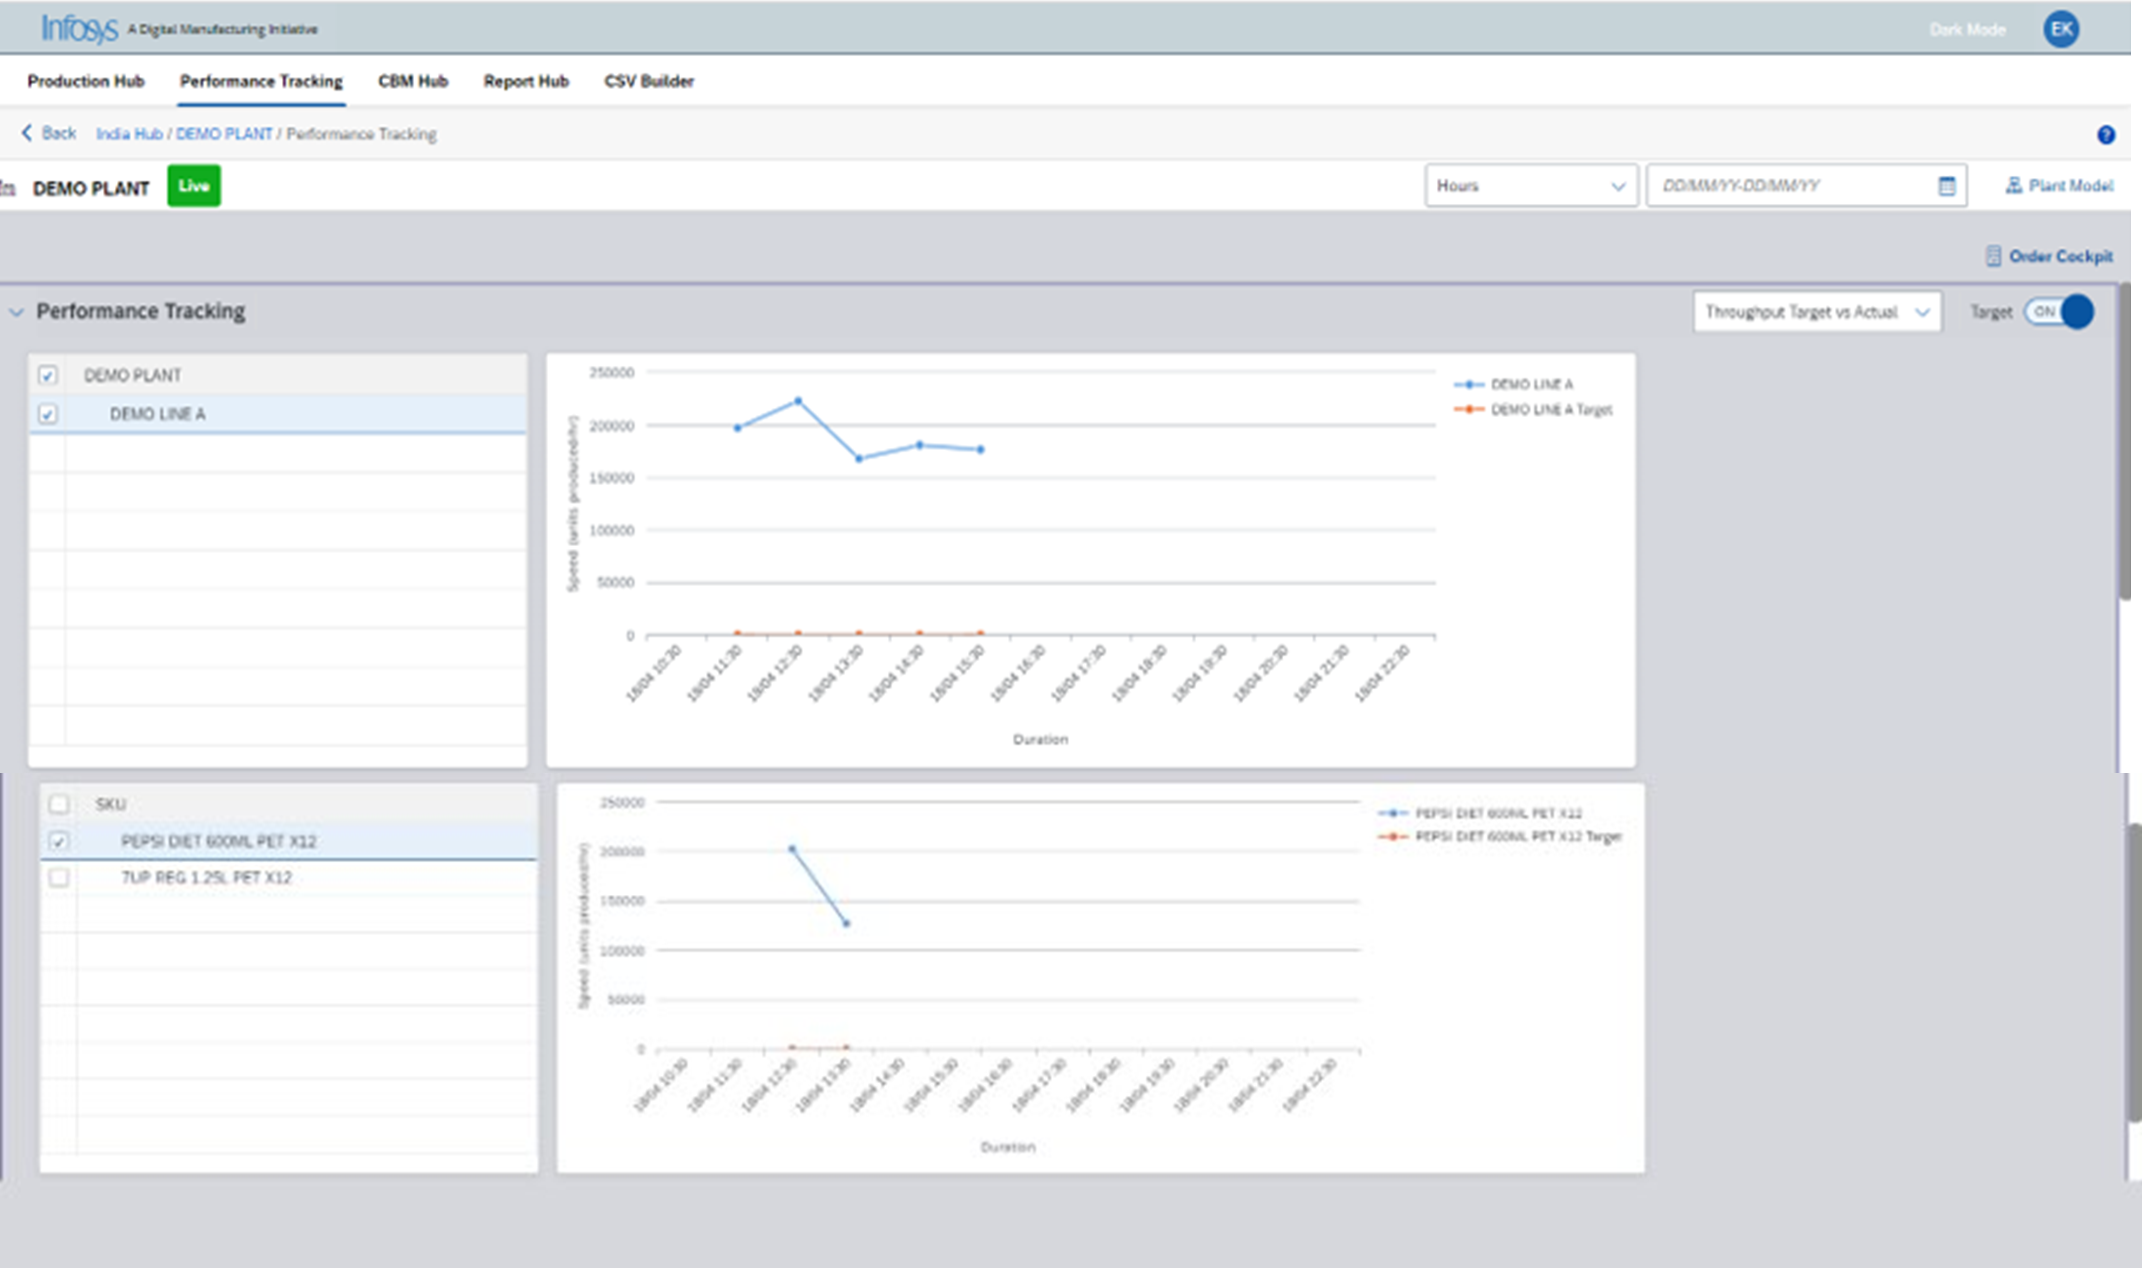
It enables the simultaneous selection of two or more lines across single or multiple facilities for performance loss comparison.
Loss Insights
This dashboard provides a comprehensive overview of line performance through four key sections: Availability Loss, Performance Loss, Quality Loss, and Fault Tracking.
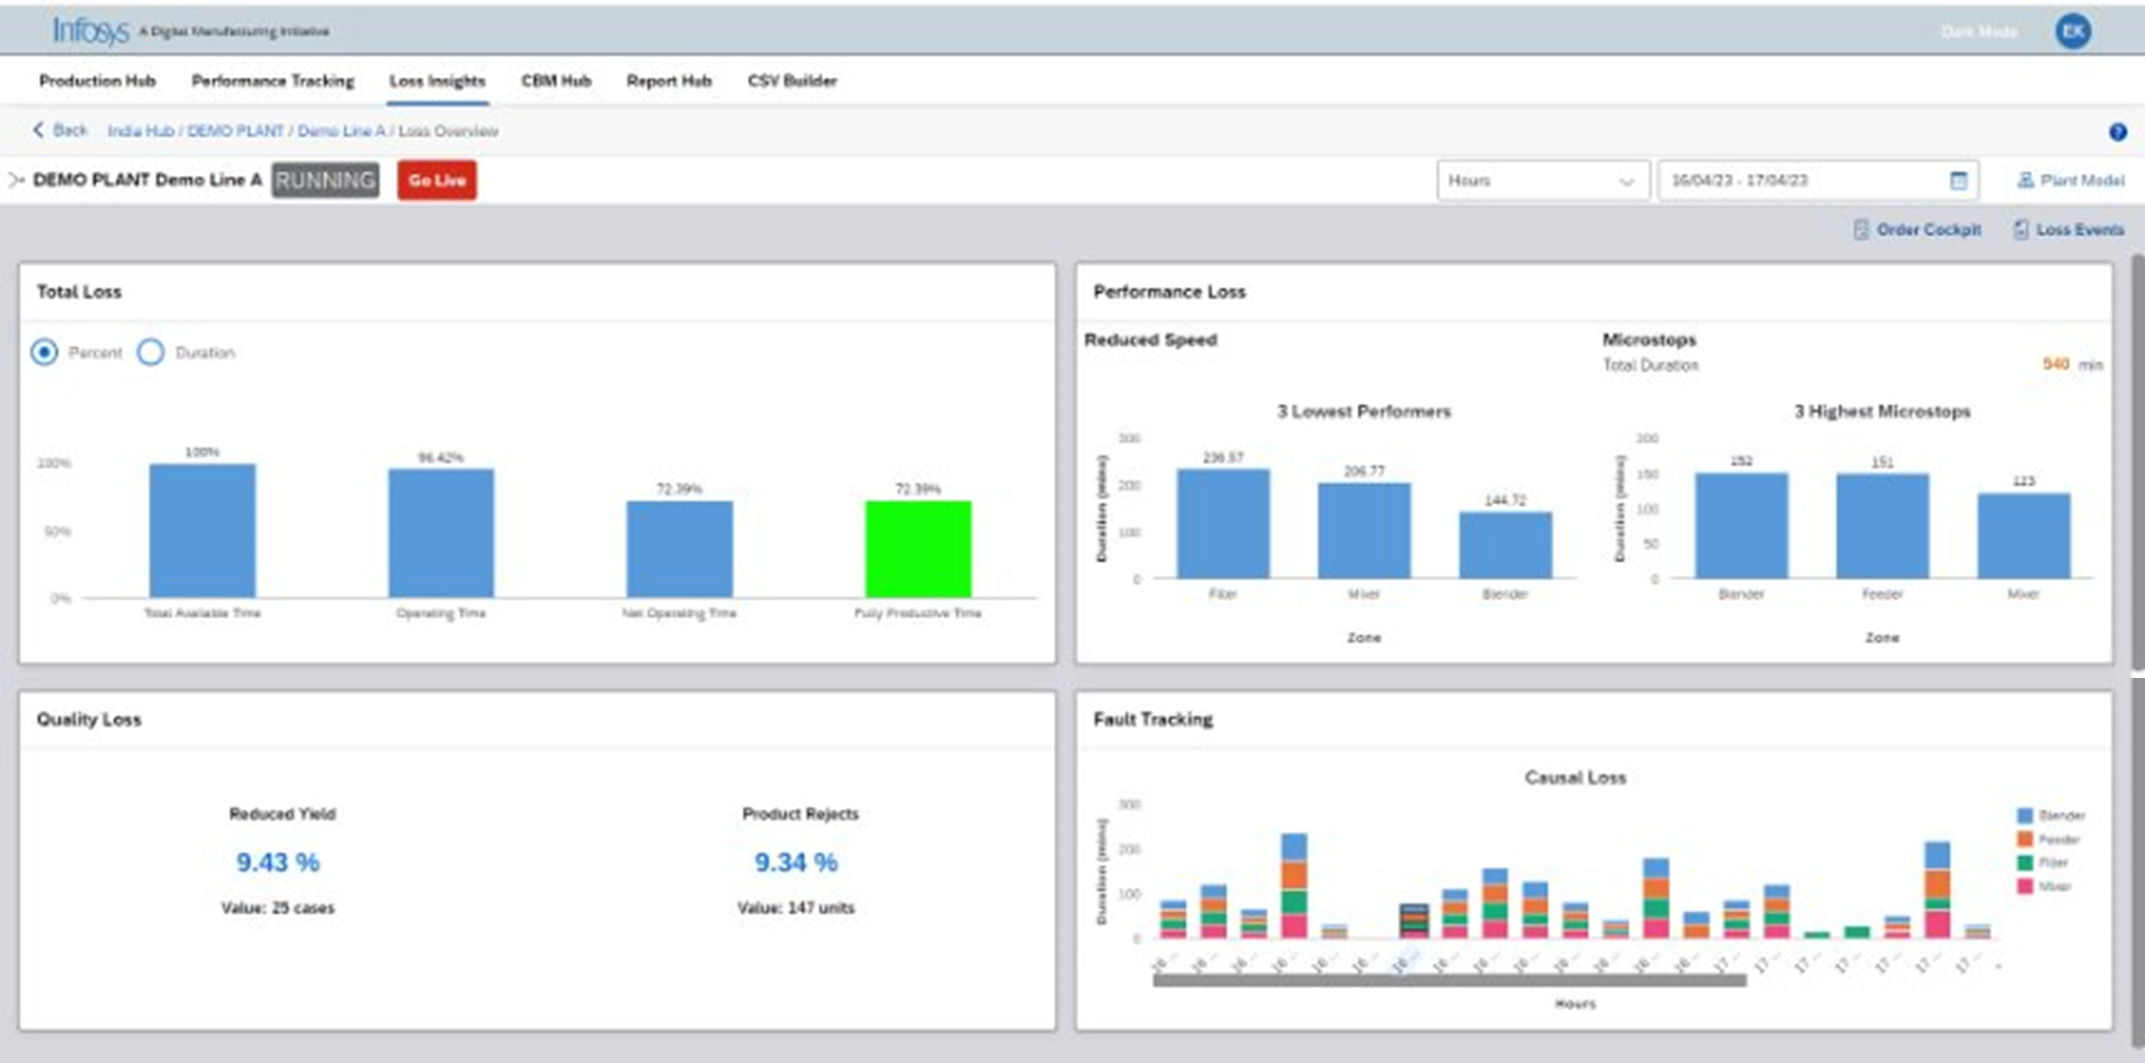
Availability Loss: Availability Loss refers to the time when a piece of equipment or a production line is not available for operation when it is scheduled to be. This downtime can be caused by various factors, preventing the equipment from performing its intended function during the planned production time.
Performance Loss: Performance Loss refers to the situation where equipment is running, but not at its maximum possible speed or capacity. This means that even during the time the equipment is available, it has not produced as much as it could.
Quality Loss: Quality Loss refers to the time and effort wasted on producing items that fail to meet quality requirements. It includes both scrap materials and products that need to be reworked.
Fault Tracking: Fault Tracking is the process of identifying, recording, analyzing, and resolving issues or failures (faults) that occur in equipment or production processes. It’s a broader concept that aims to understand the reasons behind the losses in availability, performance, and quality.
Conclusion
The insights derived from OEE, readily accessible through intuitive SAP MII dashboards, empower you to make data-driven decisions that directly impact your bottom line. Identifying and addressing the root causes of availability, performance, and quality losses translates into tangible benefits: increased efficiency, reduced waste, proactive maintenance, and ultimately, a more agile and profitable manufacturing operation.
By embracing OEE within your SAP MII framework, you’re equipping your team with the knowledge and tools to consistently strive for peak performance. So, explore the power of your SAP MII system and embark on the exciting path of transforming your manufacturing potential into tangible results.