Overview
Supply chain management & Analytics seem like two distinct concepts at the first glance, as the former is a management term and the latter is a number crunching approach; but there is a similarity in the evolution of these 2 terminologies.
· Supply Chain Management – SCM – was a subset of Operations when it got introduced to the business world. The sole scope of SCM was confined to inter- & intra-company logistics. This philosophy keeps on adapting the technology and today SCM is a huge umbrella wherein operations itself is considered as the part of Supply Chain Processes along with Planning & Control, Logistics, Customer & Supplier engagement.
· In similar fashion, Data Analytics or Data Interpretation was a part of a subject called Statistics. But traditional or conservative methods to process the numbers became inefficient as the amount of data being collected continued to grow significantly. Leveraging the computing tools & machines, Data Analytics became the GO-TO method for analyzing the collected data & making decisions based on such data.
Now the question is ‘what brings Supply Chain & Analytics together?’ – It is the ‘Huge Data’.
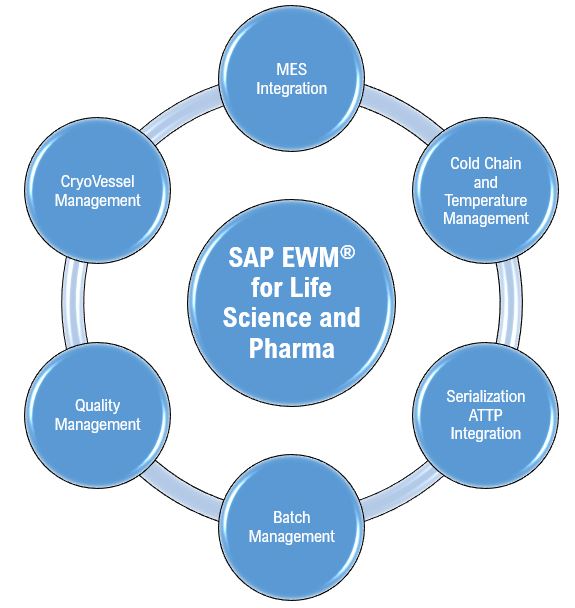
ERP applications are widely used tools to monitor supply chains. Though generic ERPs are sometimes insufficient to fulfill the demands of a few specific business processes, these ERP applications have the functionality or flexibility with which few industry-specific third-party software can be integrated with them. Hence, the overall picture looks like a web where the main ERP is at the center and is integrated with multiple tools. Thus, we can say that ERP is the tool that is best suited for transactions. These transactions generate enormous amounts of data. This is where Analytics comes into the picture.
Importance of Analytics in ERP
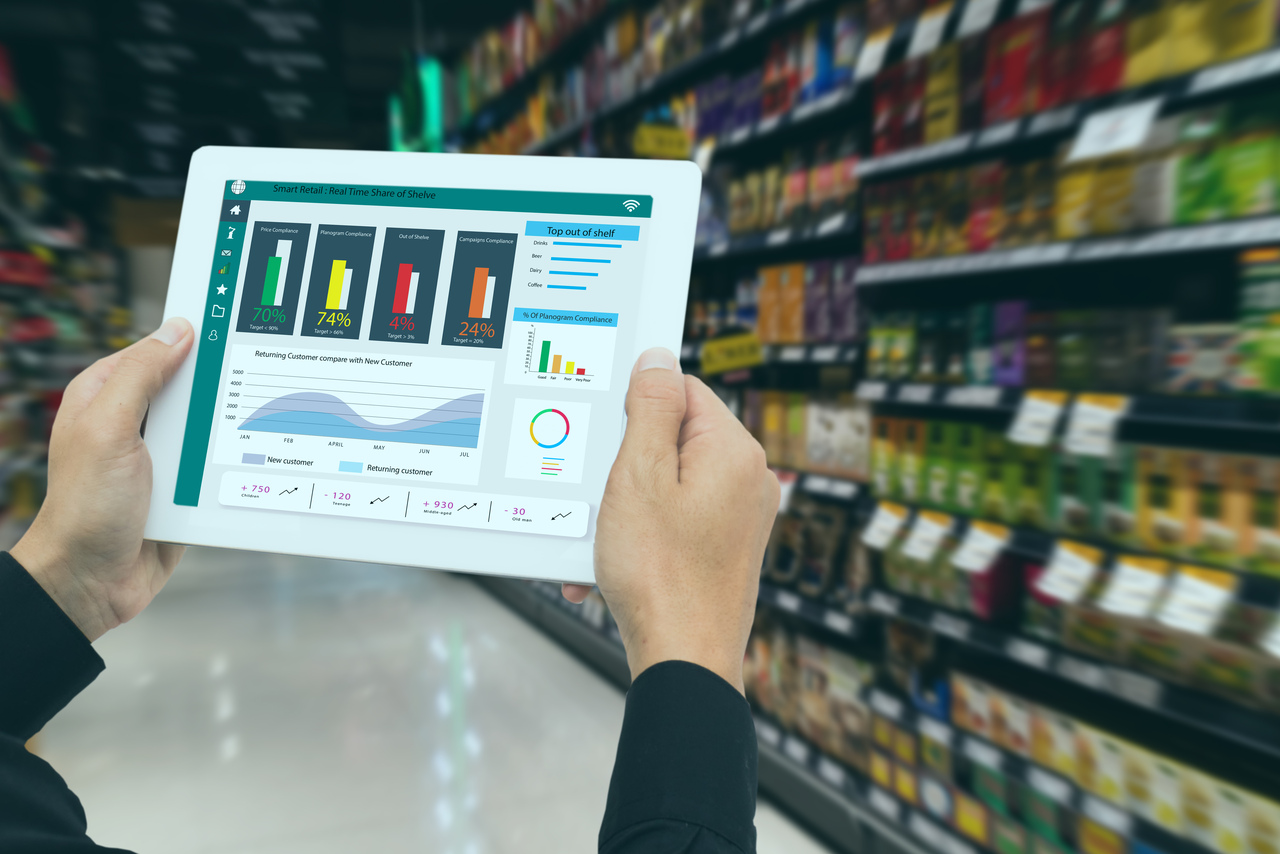
Modern Analytics solutions are utilized to analyze the data which was collected by the different sources or systems of SCM processes and to extract actionable reports from such data that can be used to improve decision-making & ultimately the efficiency of supply chain system. Analytics solutions work alongside the data creation activities thus producing real-time results, be it reports or dashboards, for the stakeholders.
Nowadays, ERP systems are evolving & integrating with modern analytics tools, thus opening new possibilities that traditional systems could not.
Let’s shed some light on a few typical business cases where these two technologies work alongside each other to produce the most out of the data that the system generates.
Case 1: ERP system is a great transaction processing tool but unable provide intelligent insights. That means, it can provide/extract transactional records related to the project, but it doesn’t give the perception around it. Thus, the data we receive from the system should be processed further as it is difficult to comprehend the ERP generated standard reports for the stakeholders chairing key positions. Here, businesses have a scope to integrate a BI tool that can create a better insight from the generated data. There are pre-packaged analytics products available/developed which can be seamlessly integrated into ERP systems. E.g., Oracle Transactional Business Intelligence for Oracle Cloud, and Power BI for JD Edwards.
These Plug & Play analytics products can collate the data, process it and can provide the comprehensive business insights. The core competency of Analytics tools is to process large data & represent it using creative data visualization methods in a way such that business leaders can get the crux of this huge data within a few seconds.
Case 2: Complex ERP system reflects the real-time processes or records, but it is very difficult to simulate what-if scenarios. E.g., Workforce changes, Sales budgets, departmental expenses, etc.
The Analytics team can work with multiple hypothetical initial conditions & can synthesize the outcomes accordingly. It is as good as simulating business scenarios. Thus, managers can take steps towards the desired outcome by choosing the optimum input for the system. When predictive analytics is paired with ERP solutions, one can have a very powerful tool that leverages historical manufacturing data, sales orders, costs, etc.
Case 3: As different applications are used throughout the business cycles, it results in inconsistency in the data format. Hence cross-application reporting becomes a challenge. Modern analytics tools can deal with such situations in a better way. Once data is extracted from these different applications, it must be harmonized and fed to Analytics tools. Such tools can generate the cross-application reports and can provide better visibility of the supply chain processes.
Case 4: It is not feasible to upgrade or customize the ERP system periodically as the development cycle time is substantial/significant. On the other hand, the development cycle time of the new feature for the analytics tools is comparatively low as these tools are highly responsive. Thus, it is more beneficial to customize the BI report than to customize the ERP report or functionality.
Let’s consider a business scenario from a procurement point of view to back the cases outlined above:
For an organization which is equipped with an ERP system along with an analytics tool embedded with it; users from all the job levels can design a dashboard for themselves. Dashboards can be curated as per the KPIs defined for a particular role or position.
For a Buyer:
– Evaluate the life cycle of purchasing documents like which POs are stuck at which stage and since when
– Calculate what is the budget for a project and how much of it is utilized
– Derive what percentage of ordered items are actually received or invoiced
For a Purchasing Manager:
– Calculate KPIs such as – How a supplier is performing on the quality measures; what is the rejection percentage in the incoming material for each supplier
– Monitor processes such as – How a buyer from each team is performing in terms of supplier communication & negotiations
Blueprinting the Right Analytics
As ERP systems offer very strong foundation of transactional data for the modern analytics tools and such tools provide the flexible as well as agile approach in which the data can be utilized & presented to the business; this combination plays out to be very effective and is getting adopted across industries.
A task of designing or improving the supply chain for a business can be very complex as there can be multiple perspectives to view supply chain process of a business.
· Micro perspective considers the basic cycles as an individual process.
E.g. Sales Order cycle, Procurement cycle, etc. to measure KPIs such as outstanding orders in a month, un-invoiced receipts, etc.
· Macro perspective considers the whole system as a single entity.
E.g. Supplier management + Inventory + Warehouse, etc. to measure KPIs such as Supplier on-time delivery performance, Inventory turns, Warehouse service levels, etc.
Though KPIs are generally designed for a departmental level or process level, data generated by the ERP systems can be analyzed considering the whole system into the account. As decision variables expand; potential of improvement increases since one can observe the bigger picture & can achieve economies of scale. At the same time, there is an increment in the complexity and the requirement in co-ordination among the departments.
Cross-track data analytics teams can handle this tradeoff between scope of improvement & simplicity. Thus, onboarding analytics teams which simultaneously work with micro as well as macro processes can be beneficial for organization in multiple ways:
· These will improve the productivity at the departmental levels by impacting key business processes like inventory planning & forecasting, demand planning
· These will make the system efficient which can ultimately decide the best strategy for the business going forward.
Analytics for the Extended Supply Chain
If one can widen the scope of ERP applications & can access or predict the key datasets of suppliers or customers using advance forecasting techniques, this can help the leadership to strategically place the enterprise in a position to take a reactive approach against the uncertainties or pro-active approach against the predicted demand patterns.
‘Pattern of a demand by customer’ is a good case in point and Asian Paints is the best example of the company that is using the data to predict the demand. This company procured the first ever supercomputer in India in 1970. The company knows which shade of colour is being sold, in what quantity, at which retailer store and at what price. Thus, company has the data for demand and price since 1970s. Even today, every transaction that gets added to the database keeps improving the accuracy of the predictions. The introduction and usage of demand patterns are not only useful for the distribution process. These also have wide-spread effects into the pre-production processes like procurement of raw materials and the production process itself. Knowing exactly what to be sold meant knowing precisely what to be produced.
Conclusion
Putting in a nutshell; Advanced Supply Chain Processes combined with Modern Analytics are complementing each other which creates a moat around the business that adapts them.
This moat can give an edge to the enterprises & help them expand with much better pace as compared with their competitors. Data, which is correct, concise & which can be accessed easily on demand can help industries to identify opportunities for improvement through tangible parameters. ERP and system integrating companies should invest in this area to develop faster, better and more reliable modern analytics solutions for supply chain processes.
References:
https://www.gartner.com/en/supply-chain/insights/supply-chain-analytics
https://insider.finology.in/success-stories/asian-paints-success-story
MicroMasters Program in SCM by EdX
SCM – A learning perspective by KAIST Business School


