Understanding BI Dashboards – A Look at Looker
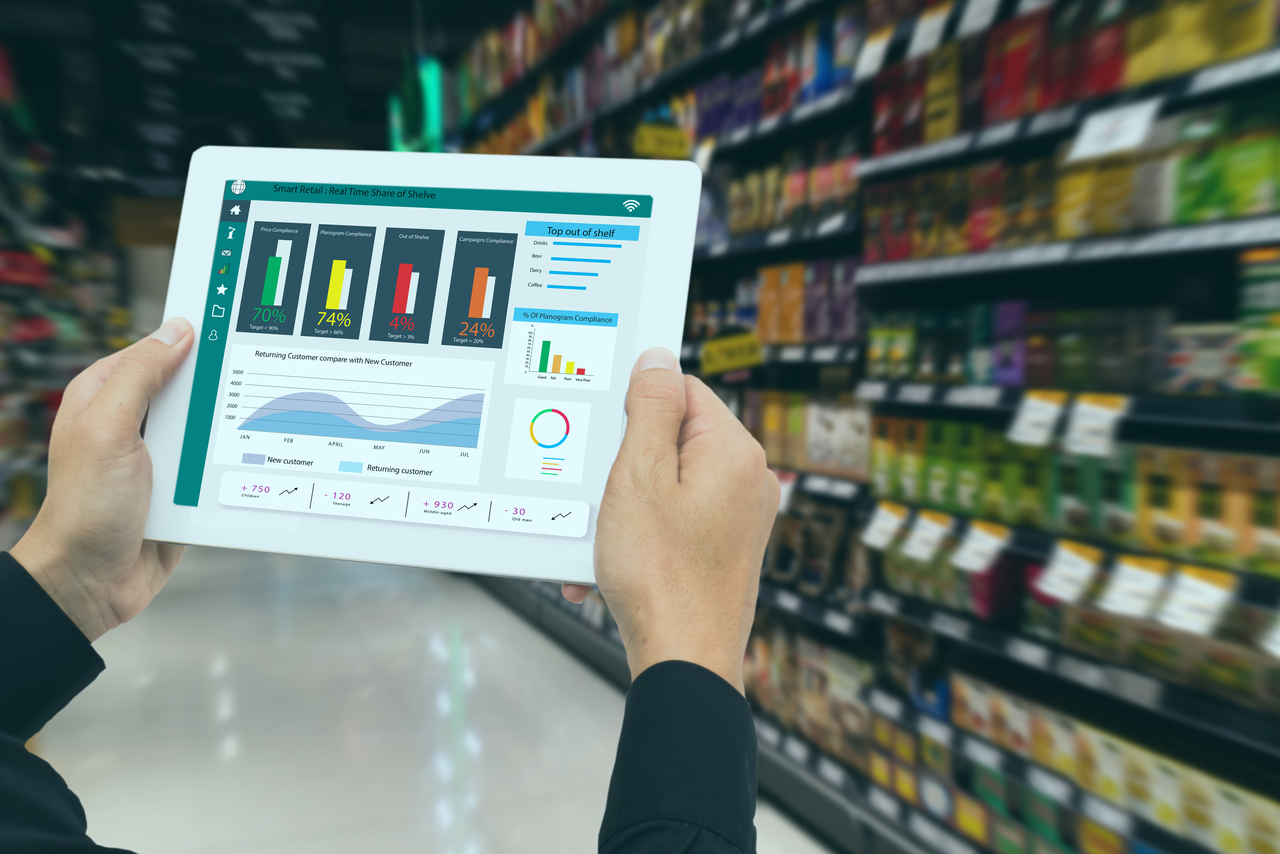
In the current landscape driven by data, organizations must derive valuable insights from their information to make well-informed choices and remain competitive. Looker, a robust business intelligence (BI) and data analysis platform, enables organizations to investigate, analyze, and represent their data in an intuitive and collaborative manner. This article offers a detailed overview of Looker, highlighting its main features, advantages, and applications.
Looker is a data analytics and business intelligence (BI) platform that enables companies to investigate, analyze, and share insights derived from data. In contrast to conventional BI tools, Looker’s architecture allows for real-time data exploration through its in-database structure and LookML modeling language, providing a unified perspective on business metrics. These key features highlight Looker’s user-friendly interface, collaborative functionalities, and options for embedded analytics. Looker supports data-driven decision-making across different departments by offering a flexible and scalable platform for accessing, visualizing, and comprehending complex data. It focuses on self-service analytics, empowering users with varying levels of technical expertise to independently explore data while ensuring data governance and security are upheld. This summary concludes by underlining Looker’s potential to enhance business growth and boost operational efficiency through insights derived from data.
Looker Overview
Looker is a contemporary business intelligence and data analytics platform that operates on your existing databases, allowing users to access and analyze data in real-time. In contrast to traditional BI tools that depend on pre-defined reports and dashboards, Looker offers a dynamic and interactive platform for data exploration and discovering previously hidden insights.
Modelling Methodology
Looker employs the LookML language as a backend process. There are over 200 connectors available along with 23 Google connectors, and additionally, Looker features 731 partner connectors, which means we can incorporate our own connector. We need to connect to Looker Studio, generate the report, visualize it in the desired format, and share it with colleagues.
Dimensions and Metrics
Dimensions and metrics are fundamental components of any report. Dimensions are known as Qualitative (e.g., Page URL, Device, City, Country), while Metrics are referred to as Quantitative (e.g., Clicks, CTR, Session, Conversion) # (We need dimensions to elaborate on metrics) #.
Use Cases
Looker can be utilized across various sectors and departments to meet a diverse array of business requirements, such as:
Sales Analytics: Monitor sales performance, recognize patterns, and predict future sales.
Marketing Analytics: Evaluate campaign performance, comprehend customer behavior, and enhance marketing expenditure.
Financial Analysis: Observe financial performance, pinpoint areas needing enhancement, and make educated investment choices.
Customer Success: Analyze customer retention, identify customers at risk of leaving, and enhance overall customer satisfaction.
Operations Management: Monitor operational metrics, recognize bottlenecks, and streamline processes.
Interface of Looker
The Looker interface is crafted to make data investigation and analysis accessible to a diverse array of users, including business analysts and developers.
Its user-friendly design, interactive functionalities, and robust LookML modeling language render it an effective tool for extracting insights from data.
After clicking on create, we will be presented with three choices: Report (New Report), Data Source (Connection), and Explorer (where we can experiment using the explorer). By selecting add page, we can include several pages within a single report. We have the ability to rename each page individually. One Report can contain multiple pages. In the section for adding data to the report, there are two options: the first is to connect to data and the second is My data sources (where sample data is accessible). The structure here includes Visuals, charts, and data, similar to Power BI.
In Explorer, this is the primary area for ad-hoc data exploration and analysis. we can play with data and can check the look and feel of the visual and if you like the visual/data you can share that in your report.
We have template of looker and can only change the data if we like the report visual whatever has been used in the template version as per own need. Then we can edit few things and share.
We have 6 options available at the left-hand corner of the dashboard such as create, recent, shared with me, owned by me, Trash and Templates (We can take inspiration from here).
To add the date range in the report, use data range from add a control option.
In add a chart, we have cards available.
Looker’s interface is designed to be user-friendly and intuitive, catering to both technical and non-technical users. It’s a web-based interface, accessible through any modern browser.
Key Features and Advantages
In-Database Architecture: Looker’s in-database architecture allows for direct querying of data from your database, eliminating the necessity for cubes or data extraction. This ensures that users always work with the most up-to-date data.
LookML: Looker’s unique data modeling language, LookML, permits developers to define business logic and relationships between data in a consistent and reusable way. This ensures that all employees across the organization share the same definitions and metrics.
User-Friendly Interface: Looker’s intuitive interface allows users of various technical abilities to easily navigate and analyze data. Users can create customized dashboards, reports, and visualizations without needing to write complex SQL queries.
Cooperation and Sharing: Looker fosters collaboration by allowing users to share dashboards, reports, and data analyses with coworkers. This enables everyone to take part in the decision-making process within a data-centric environment.
Embedded Analytics: By incorporating Looker into other applications, organizations can provide clients and partners with insights based on data.
API and Integrations: Looker serves as a versatile platform for any organization due to its API and integrations, which allow connectivity with various data sources and applications.
Conceptual Diagram
+——+| Data Sources |—->| Looker Platform |—->| End Users | +——(All three are connected to application) ——+ | Applications | +——+
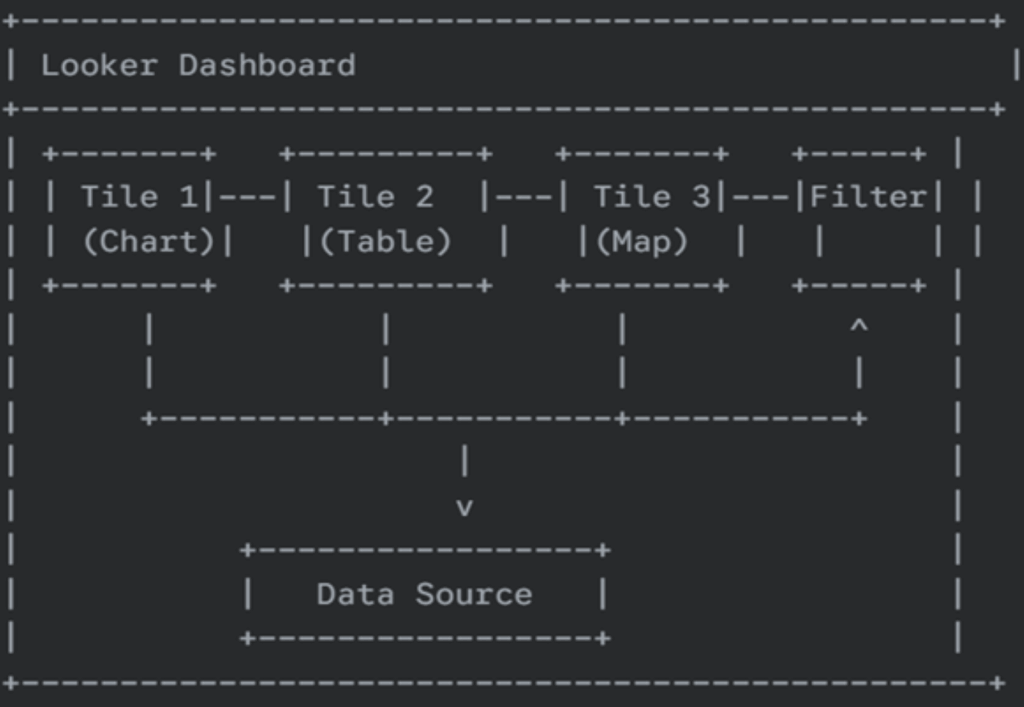
Tiles: These are distinct visual representations (such as charts, tables, maps, etc.) or other components (including text boxes and images).
Filters: These are controls that enable users to interactively refine the data shown in the tiles. Filters can impact one or several tiles simultaneously.
Data Source: This refers to the foundational database or data connection that Looker queries to generate the visualizations. Generally, all tiles on a dashboard utilize the same data source, although it can become more intricate with derived tables.
Arrows: These signify the direction of data flow and user interaction. Filters influence the data presented in the tiles, while tiles showcase data sourced from the data connection.
More Detailed Diagram (Focus on Tile Interaction):
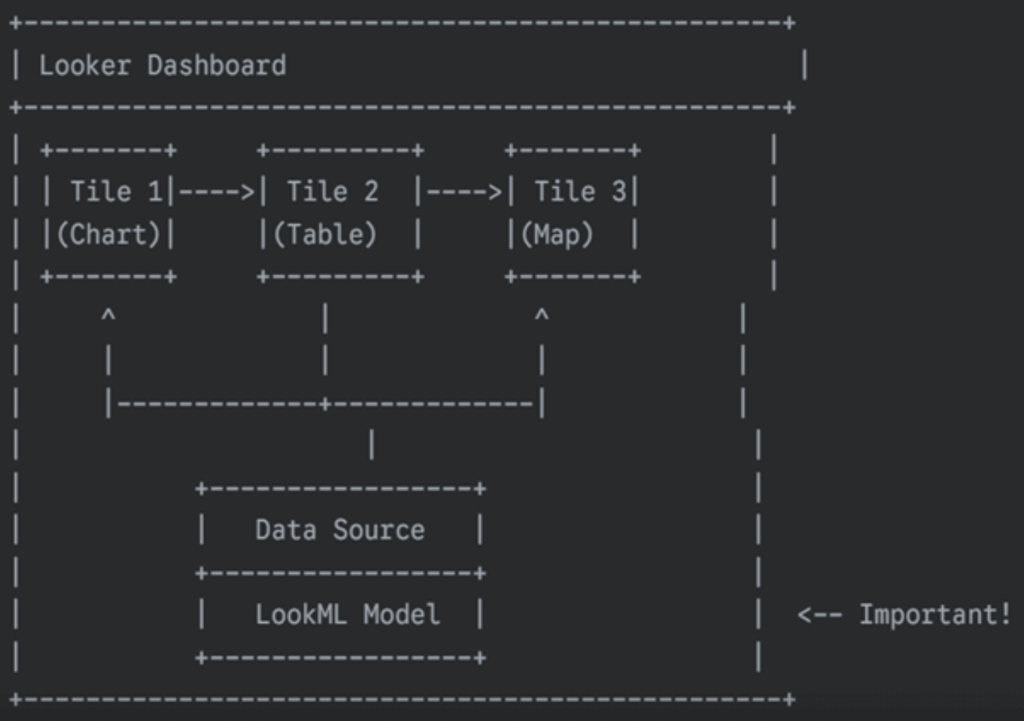
This diagram adds the LookML Model. LookML is the crucial layer that sits between the dashboard and the data source. It defines the data relationships, calculations, and dimensions that are available for use in the tiles. The tiles don’t directly query the database; they query the LookML model.
The arrows between the tiles in this diagram could represent cross-filtering. For example, clicking on a data point in Tile 1 (the chart) could filter the data displayed in Tile 2 (the table) and Tile 3 (the map). This is a common interactive feature of Looker dashboards.
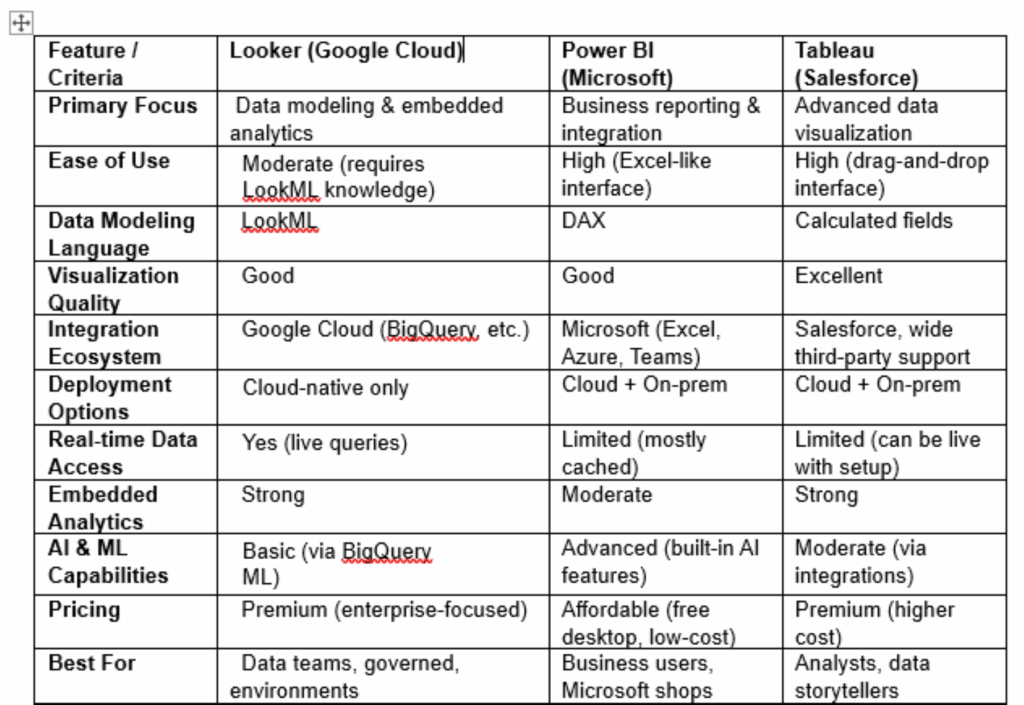
Comparison of Looker with other Visualization Tool
Important Points to Remember
LookML Role: The Significance of LookML It is important to highlight that LookML plays an integral role. The semantic layer offers a consistent and controlled view of the data.
Interactivity: Modern dashboards are highly interactive. While the examples provided demonstrate basic interactions, Looker dashboards can feature more complex data actions, interconnected dashboards, and drilldowns.
Flexibility: Looker dashboards provide significant flexibility. It is feasible to mix various types of visualizations and organize tiles in diverse arrangements.
Exploring and Analyzing data
Working with Looks: Looks consist of saved queries and explorations in Looker. This section explains how to create, save, modify, and share Looks, including filtering, sorting, and pivoting data within a Look.
Building Dashboards: Dashboards are collections of visualizations and looks that offer a holistic view of data. This section outlines how to create interactive dashboards, incorporate visualizations, arrange components, and implement filters.
Data Exploration: This section illustrates the fundamental capabilities of navigating data in Looker. It explains the use of filters, sorts, pivots, and drilldowns to extract insights.
Visualizations: Looker provides a range of chart types, such as bar charts, line charts, pie charts, and maps. This section describes how to select the appropriate visualization for your data and tailor its appearance.
Calculations and Measures: This section details how to develop custom metrics and calculations using LookML or table calculations within the explore. It covers aggregation functions, mathematical operations, and date/time functions.
Drilling Down: Drilldowns enable users to examine data at various levels of detail. This section illustrates how to configure drilldowns in LookML and utilize them in dashboards and Looks.
Sharing and Collaboration: Looker supports teamwork by enabling users to share content with others. This section explains the process of sharing Looks, dashboards, and folders, as well as collaborating on data explorations.
Managing Looker
User Administration: This section covers how to create, oversee, and remove user accounts within Looker. It details how to assign roles and permissions to individuals, shaping their access to data and functionalities.
Security: The security aspect is vital for Looker administration. It encompasses authentication methods, authorization configurations, data access management, and additional security measures.
Databases Connections: Looker interfaces with a variety of databases to retrieve data.
Performance Monitoring: Keep track of Looker’s performance and pinpoint potential issues.
Data Backups and Restorations: Regularly scheduled backups are crucial for safeguarding data.
Looker API: The Looker API enables developers to programmatically interact with Looker.
Embedded Analytics: Looker can be integrated into other applications, enabling companies to deliver data-driven insights to their clients and partners.
LookerML (Looker Modelling Language):
This section introduces LookML, the robust data modeling language of Looker. It outlines the function of LookML and its fundamental concepts, including views, measures, and dimensions.
Views serve as the cornerstone of LookML, defining how data is accessed and displayed to users. Measures represent calculations that aggregate data, like sums, averages, and counts. Dimensions are attributes that classify and group data, such as dates, product names, and customer categories. Derived tables are pre-aggregated tables designed to enhance query performance. Filters and parameters enable users to engage with data and personalize their explorations.
Advanced Topics: – The Looker Marketplace provides pre-built LookML projects, dashboards, and visualizations that can expedite development.
Data actions allow users to execute operations on data directly from Looker, including updating records in a database or sending emails. Looker accommodates multiple languages, enabling users to utilize the platform in their preferred language, a feature known as Localization. Performance optimization and troubleshooting also play significant roles in Looker.
Data Analysis using various functions in Looker
Drill down feature: This feature allows for deeper data analysis. For instance, if we consider the country as a dimension and wish to see new user data segmented by city (the next level of detail following country level data), it will display the new user data organized by city.
Conditional Formatting: This involves formatting based on specific criteria. In the styling section, you’ll find two options: single color and color scale.
Connect and Import Google sheet: Connecting and Importing Google Sheets: – Looker enables the use of Google Sheets, offering five options to select from: All items (where you can import the entire data structure from your Google Sheet), Owned by me, Starred, URL, and Open from Google Drive. Within the ALL ITEMS option, you can further configure three settings: Use the first row as a header (ensuring column headers are unique, as columns with empty headers will not be included), Include hidden and filtered cells, and Include Specific range from Google sheet (e.g. A3:D4).
Note: – To input any formula in Looker, use the ‘Add a field’ option found in the bottom right corner.
Data Control Features: To set up controls, utilize the ‘Add a control’ feature. Looker provides eight types of controls: Drop-down list, fixed-size list, Input list (where you can submit your own input), Advanced filter, Slider, Checkbox, Date range control, and Data control. Looker is particularly popular for the date range control.
Custom fields and Concatenation: This function is used to merge or combine two columns into one result. A custom field, also referred to as a user-defined field, can be created by going to add dimension and selecting create field.
Running calculation: The running function is recognized for summing two values to produce a third result. The structure below illustrates the running function:
1 1
2 3
3 6
4 10
5 15
Types of running functions include:
Running Sum
Running Min
Running Max
Running Count
Running Average
Running Delta
Case Function: If it’s necessary to divide data into two categories, for example, weekly data from Monday to Sunday can be separated into Weekday data (Monday to Friday) and Weekend data (Saturday and Sunday). The case function can be applied in the resources tab -> Manage added data sources (where you’ll find your imported data) -> Edit -> Add a field.
Data Blending: When we need to incorporate two or more data sources onto a single page, the data blending technique can be utilized.
Community Visualization: This refers to custom visuals similar to those in Power BI desktop. You can easily access any community visual from the Google market to reference and use. For example, ‘Clicks’.
Conclusion
Looker serves as an effective and adaptable BI and data analytics platform, allowing organizations to fully leverage their data. Its in-database framework, LookML modeling language, intuitive interface, and collaborative features render it an excellent choice for businesses of every size. By utilizing Looker, organizations can uncover valuable insights from their data, make well-informed decisions, and drive business expansion.